Background and features
Background
Since the ban of spiked tire in the 1990th, the use of salt increased year by year. There was a call for reduction in salt application toward reducing winter road maintenance costs and extending the service life of road structures. Salinity control is indispensable for maintaining appropriate salinity while securing safety. Salinity used to be measured from a site to site as point data, but it was necessary to obtain continuous data to this end. To address this need, we developed an on-board salinity sensor and made it into practical use.
Features
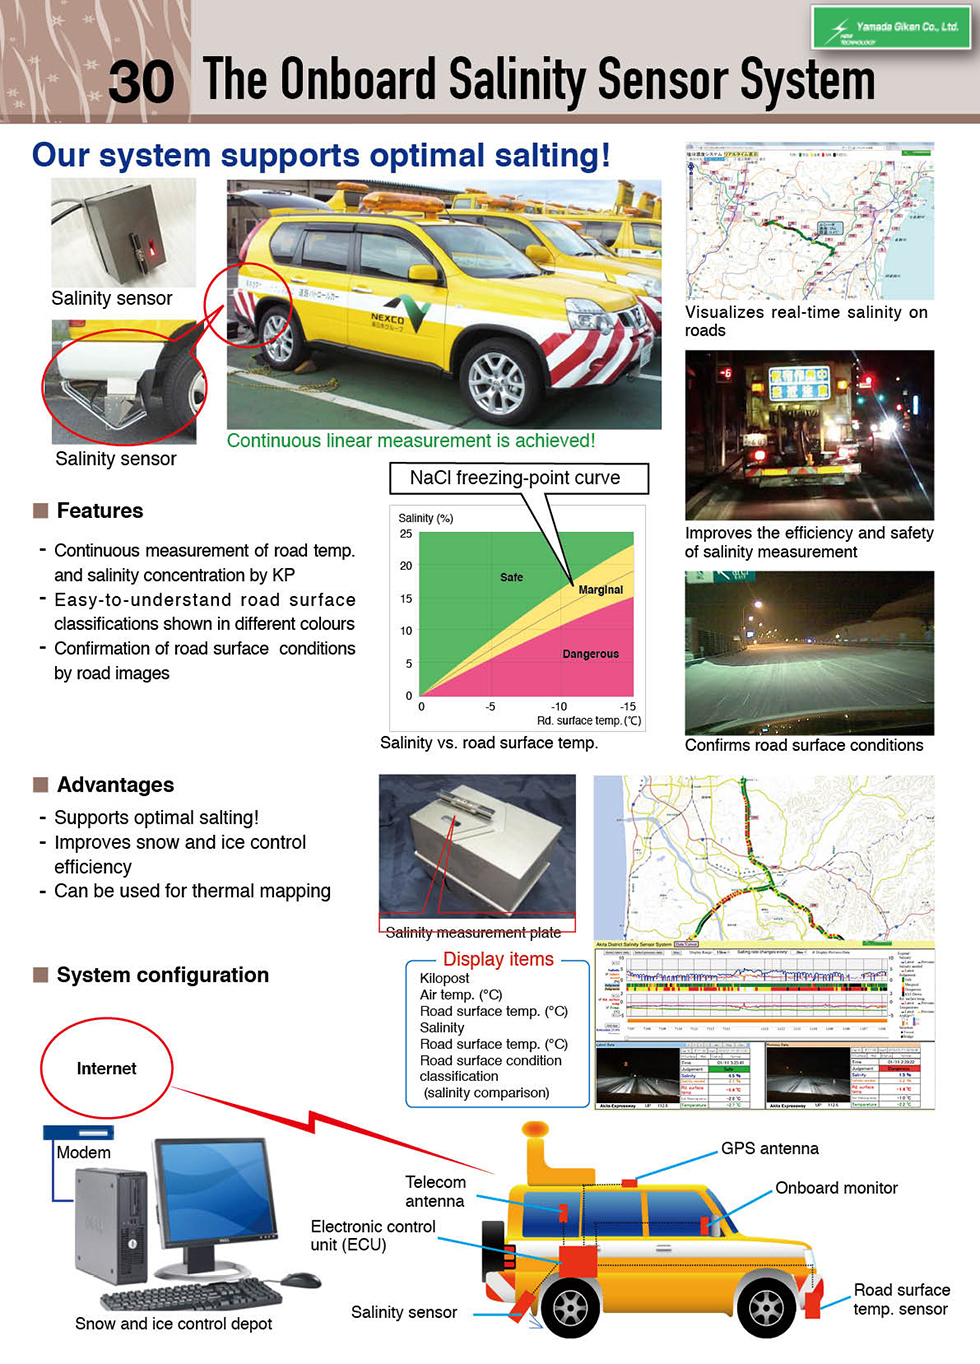
The Onboard Salinity Sensor System of Yamadagiken has following features:1) Continuous measurement of road temp. and salinity concentration by KP2) Easy-to-understand road surface classifications shown in different colours, and3) Confirmation of road surface conditions by road images
Advantages
The advantages of the Onboard Salinity Sensor System of Yamadagiken include:
1) The system supports optimal salting
2) The system improves snow and ice control efficiency, and
3) The system can be used for thermal mapping
Our system allows continuous measurements of salinity and road surface temperature along the road, instead of their manual. point measurements. Using GPS, the data combined the measurement locations and measurement values of salinity and road surface temperature enables freezing temperature of the location immediately. Therefore, not experience based but scientific-based decision making on salting is possible.
The road patrol personnel do not get off the patrol vehicle to measure the salinity. Therefore, safety of patrol personnel is improved, and time taken for patrol is shortened. These result efficiency improvement of snow and ice control works. In addition, thermal mapping allows to identify locations tended to be icy and dangerous,
System configuration
Let’s show you the configurations of our system.
Salinity control software (real-time display of salinity)
You can compare the previous measurement data and images on one screen. Changes in salinity and road surface temperature are clearly shown. The salinity can be shown in a graph or along road on a road map by different colour.